Your program is now downloading
This may take a few seconds!
Related PowerPoint Templates
Free download
Exquisite green villain and industrial gear PPT background chart
Exquisite green villain and industrial gear PPT background chart

Four stereo gear linkage relationship PPT template
Four stereo gear linkage relationship PPT template
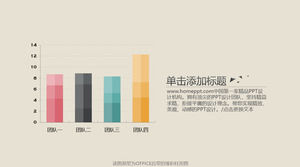
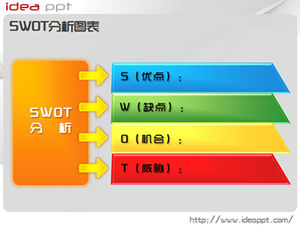
10 sets of colorful IDEAPPT original ppt charts package download
10 sets of colorful IDEAPPT original ppt charts package download
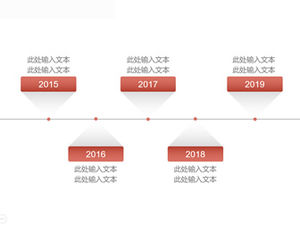
9 sets of exquisite and simple timeline ppt charts
9 sets of exquisite and simple timeline ppt charts
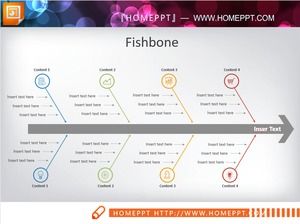
Causal analysis of icon decoration PPT fishbone diagram
This is an icon decoration, color causal analysis PPT fishbone diagr...